
Tags and keywords
The slide shows trails versions of Internal Block Diagram (IBD) Figure 47: Internal structure of test bed from signal source to sink (with different Port label display modes):
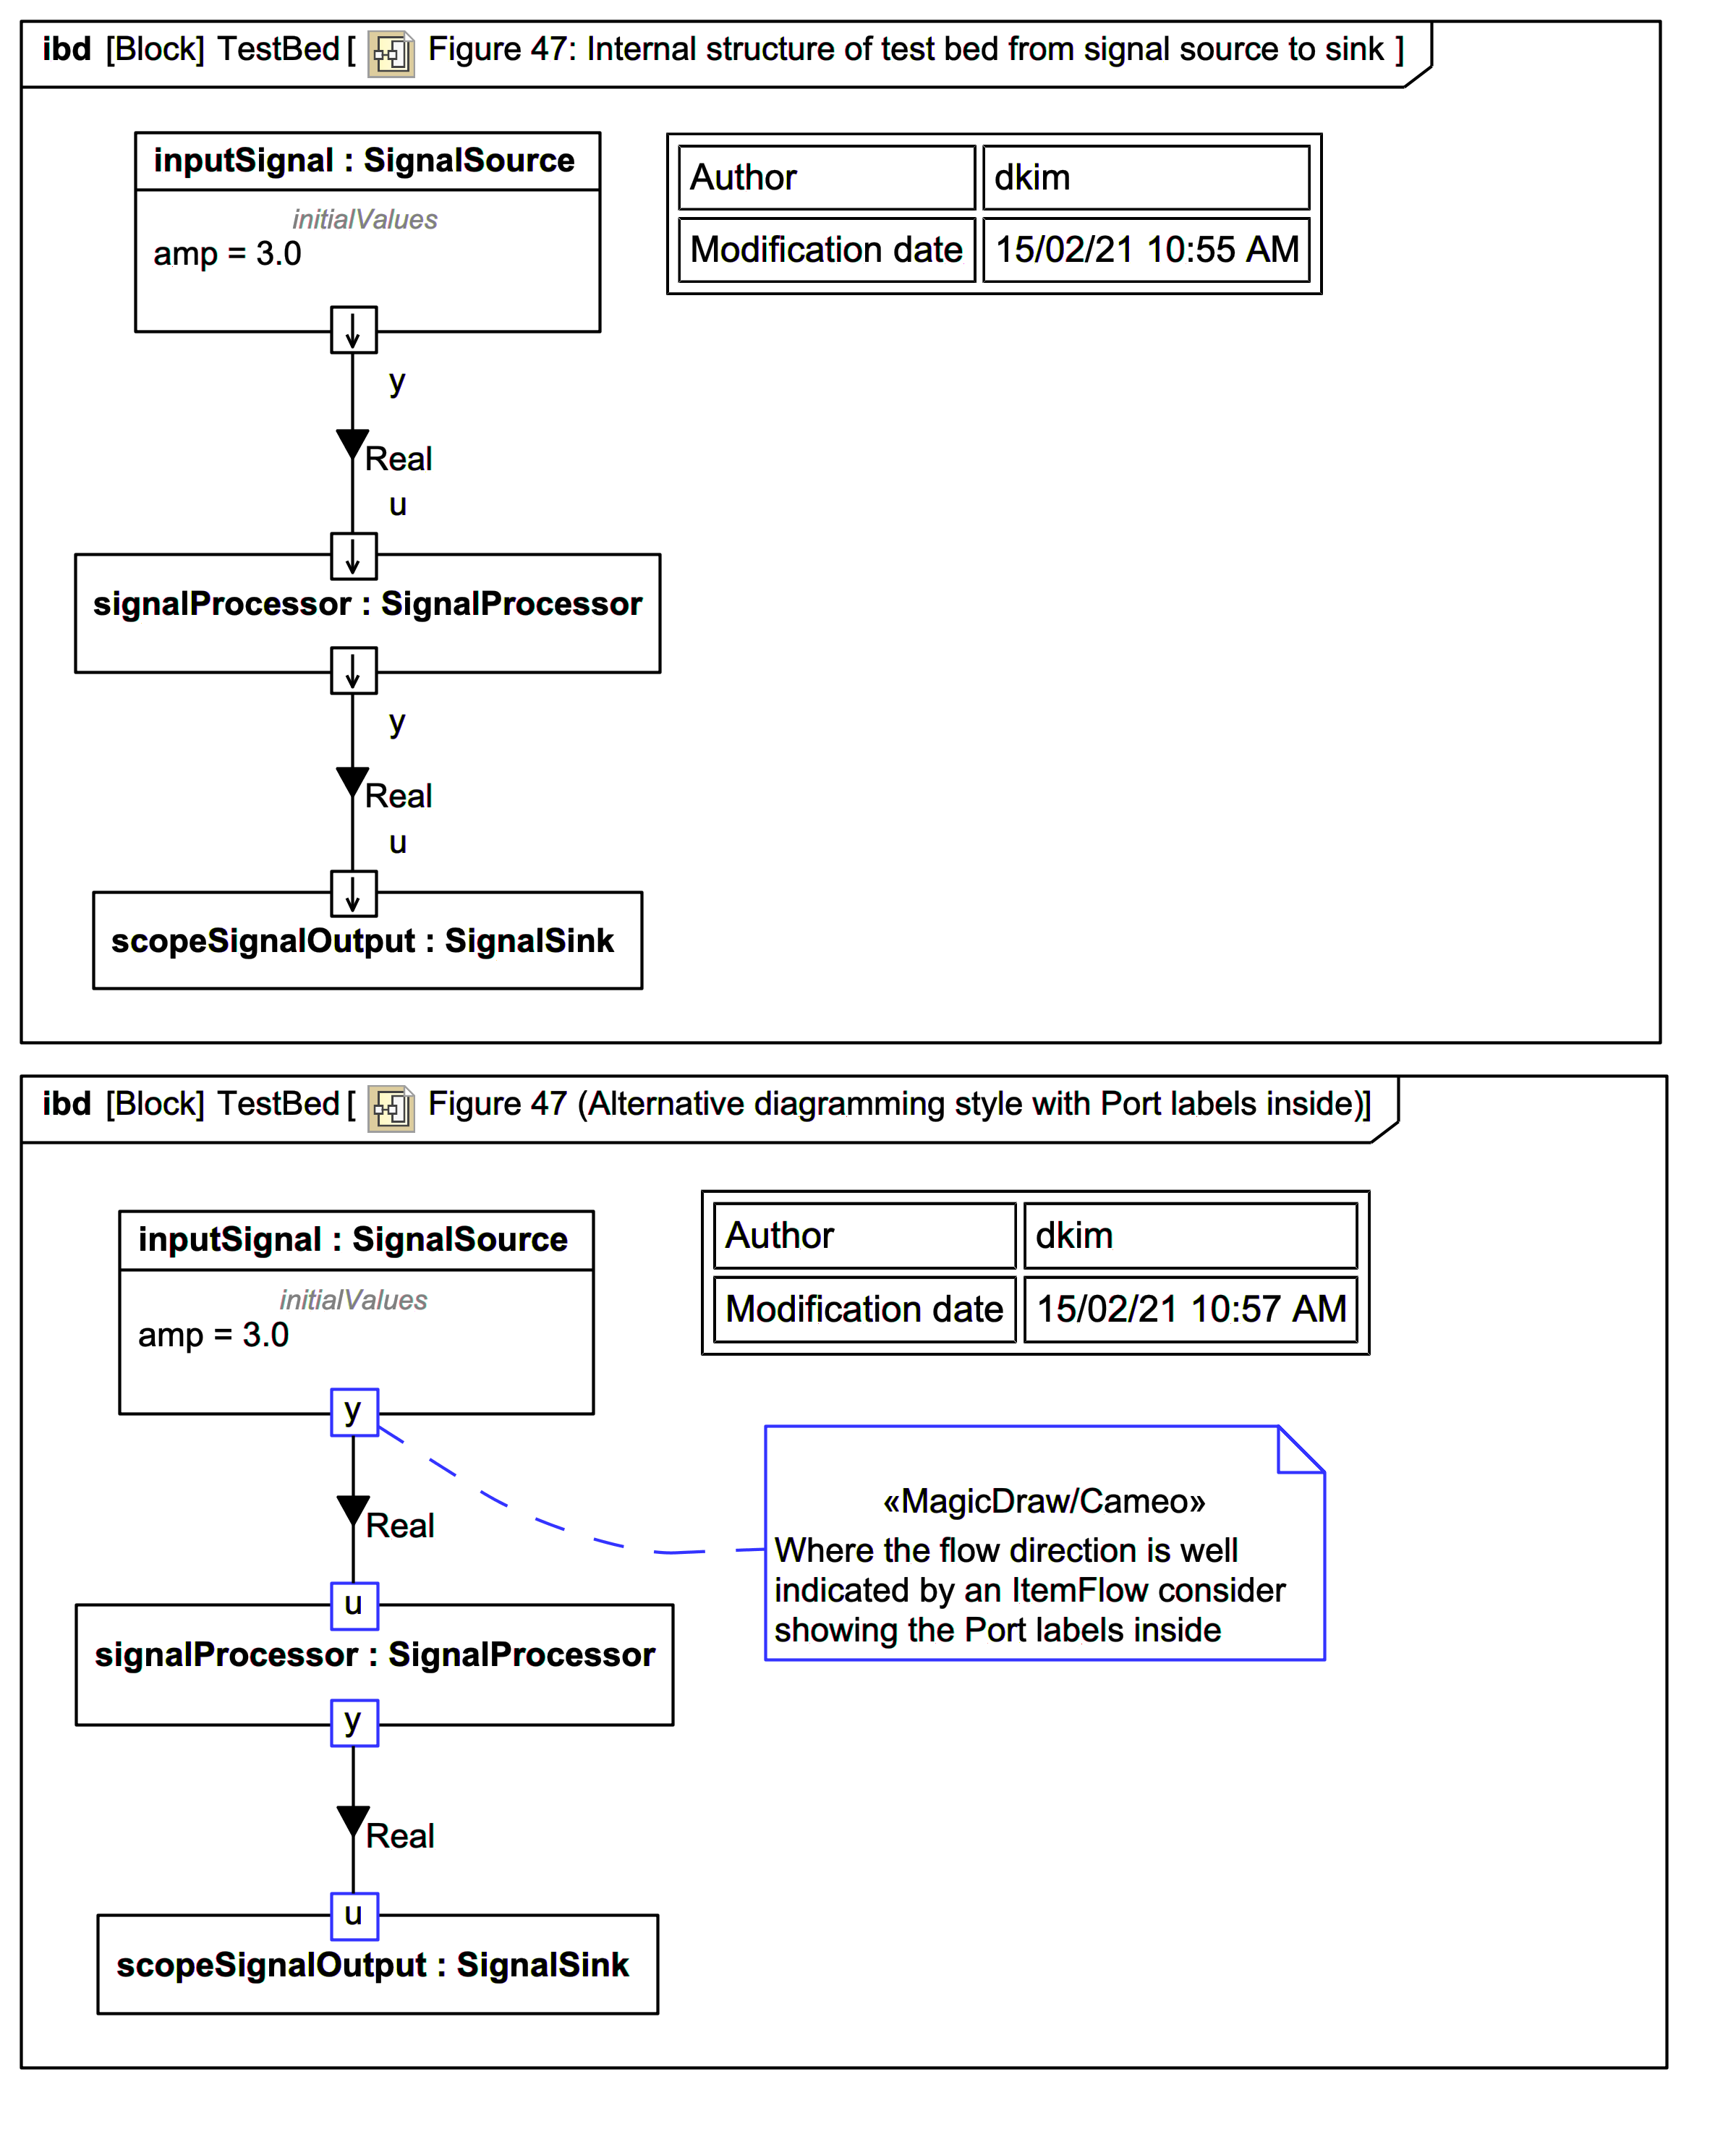
SysPhS-1.1: 'Part properties, typed by blocks ... represent the components of the system. They are connected through ports .. which represent signal outputs and inputs ... Signals pass through ports in the direction shown by the arrows. Item flows on connectors indicate that the signals are real numbers.'
SysPhS-1.1: 'Figure 47 connects a signal source to a signal processor, which it connects to a signal sink that displays the output.'
The context-specific value 3.0 for amp is shown in the initialValues compartment on inputSignal:SignalSource.
It's time now to see inside the SignalProcessor block, but we'll once again look at the BDD before the IBD (so in the reverse order from the spec).