ARCHIVAL (1998): This content is now considered historical only!

HERA particle accelerator: electron Beam Loss Monitor lifetime disruption plots

Keywords
Image kind
Click on the image to view it full size
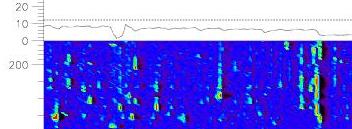
The rate of beam loss monitor events from lo to hi is given as a coloured area plot over:
  • x-axis: time.
  • y-axis (lower): the index of the Electron Beam Loss Monitor (BLME) around the HERA electron storage ring.
  • y-axis (upper): the electron beam current.
Disruptions of the electron beam lifetime by charged macroparticles are revealed in the plots as slanted "hot" rate streaks. The novel plot strategy confirmed the existence, nature, scale and frequecny of the suspected disruptions.
Gallery
Visit also
Visit also (backlinks)
Related activities
Flags