Tags and keywords
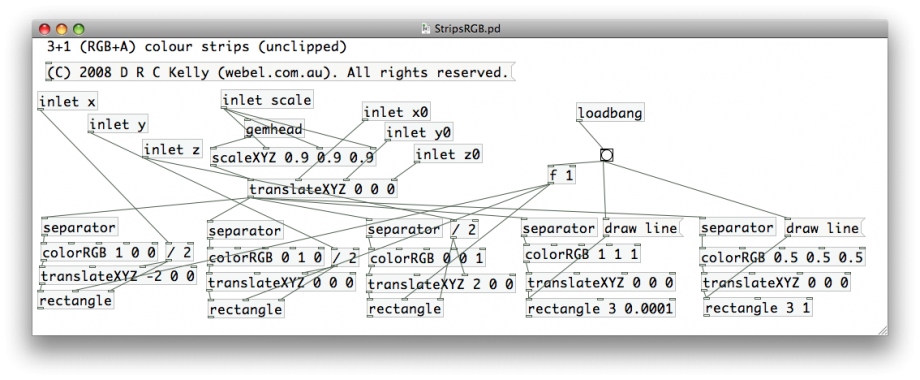
Generates the 3 "signal thermometer" bars in the Drancel RGB PureData/GEM accelerometer monitors, from the (R,G,B) values corresponding to the (X,Y,Z) accelerometer signals, relative to the calibration "home".
Typically 1 bar is below the home line, while the 2 others are above - or vice-versa; imagine a fixed amount of water slopping between three buckets with marker lines at the middle of each bucket.


